Metrics and Analysis
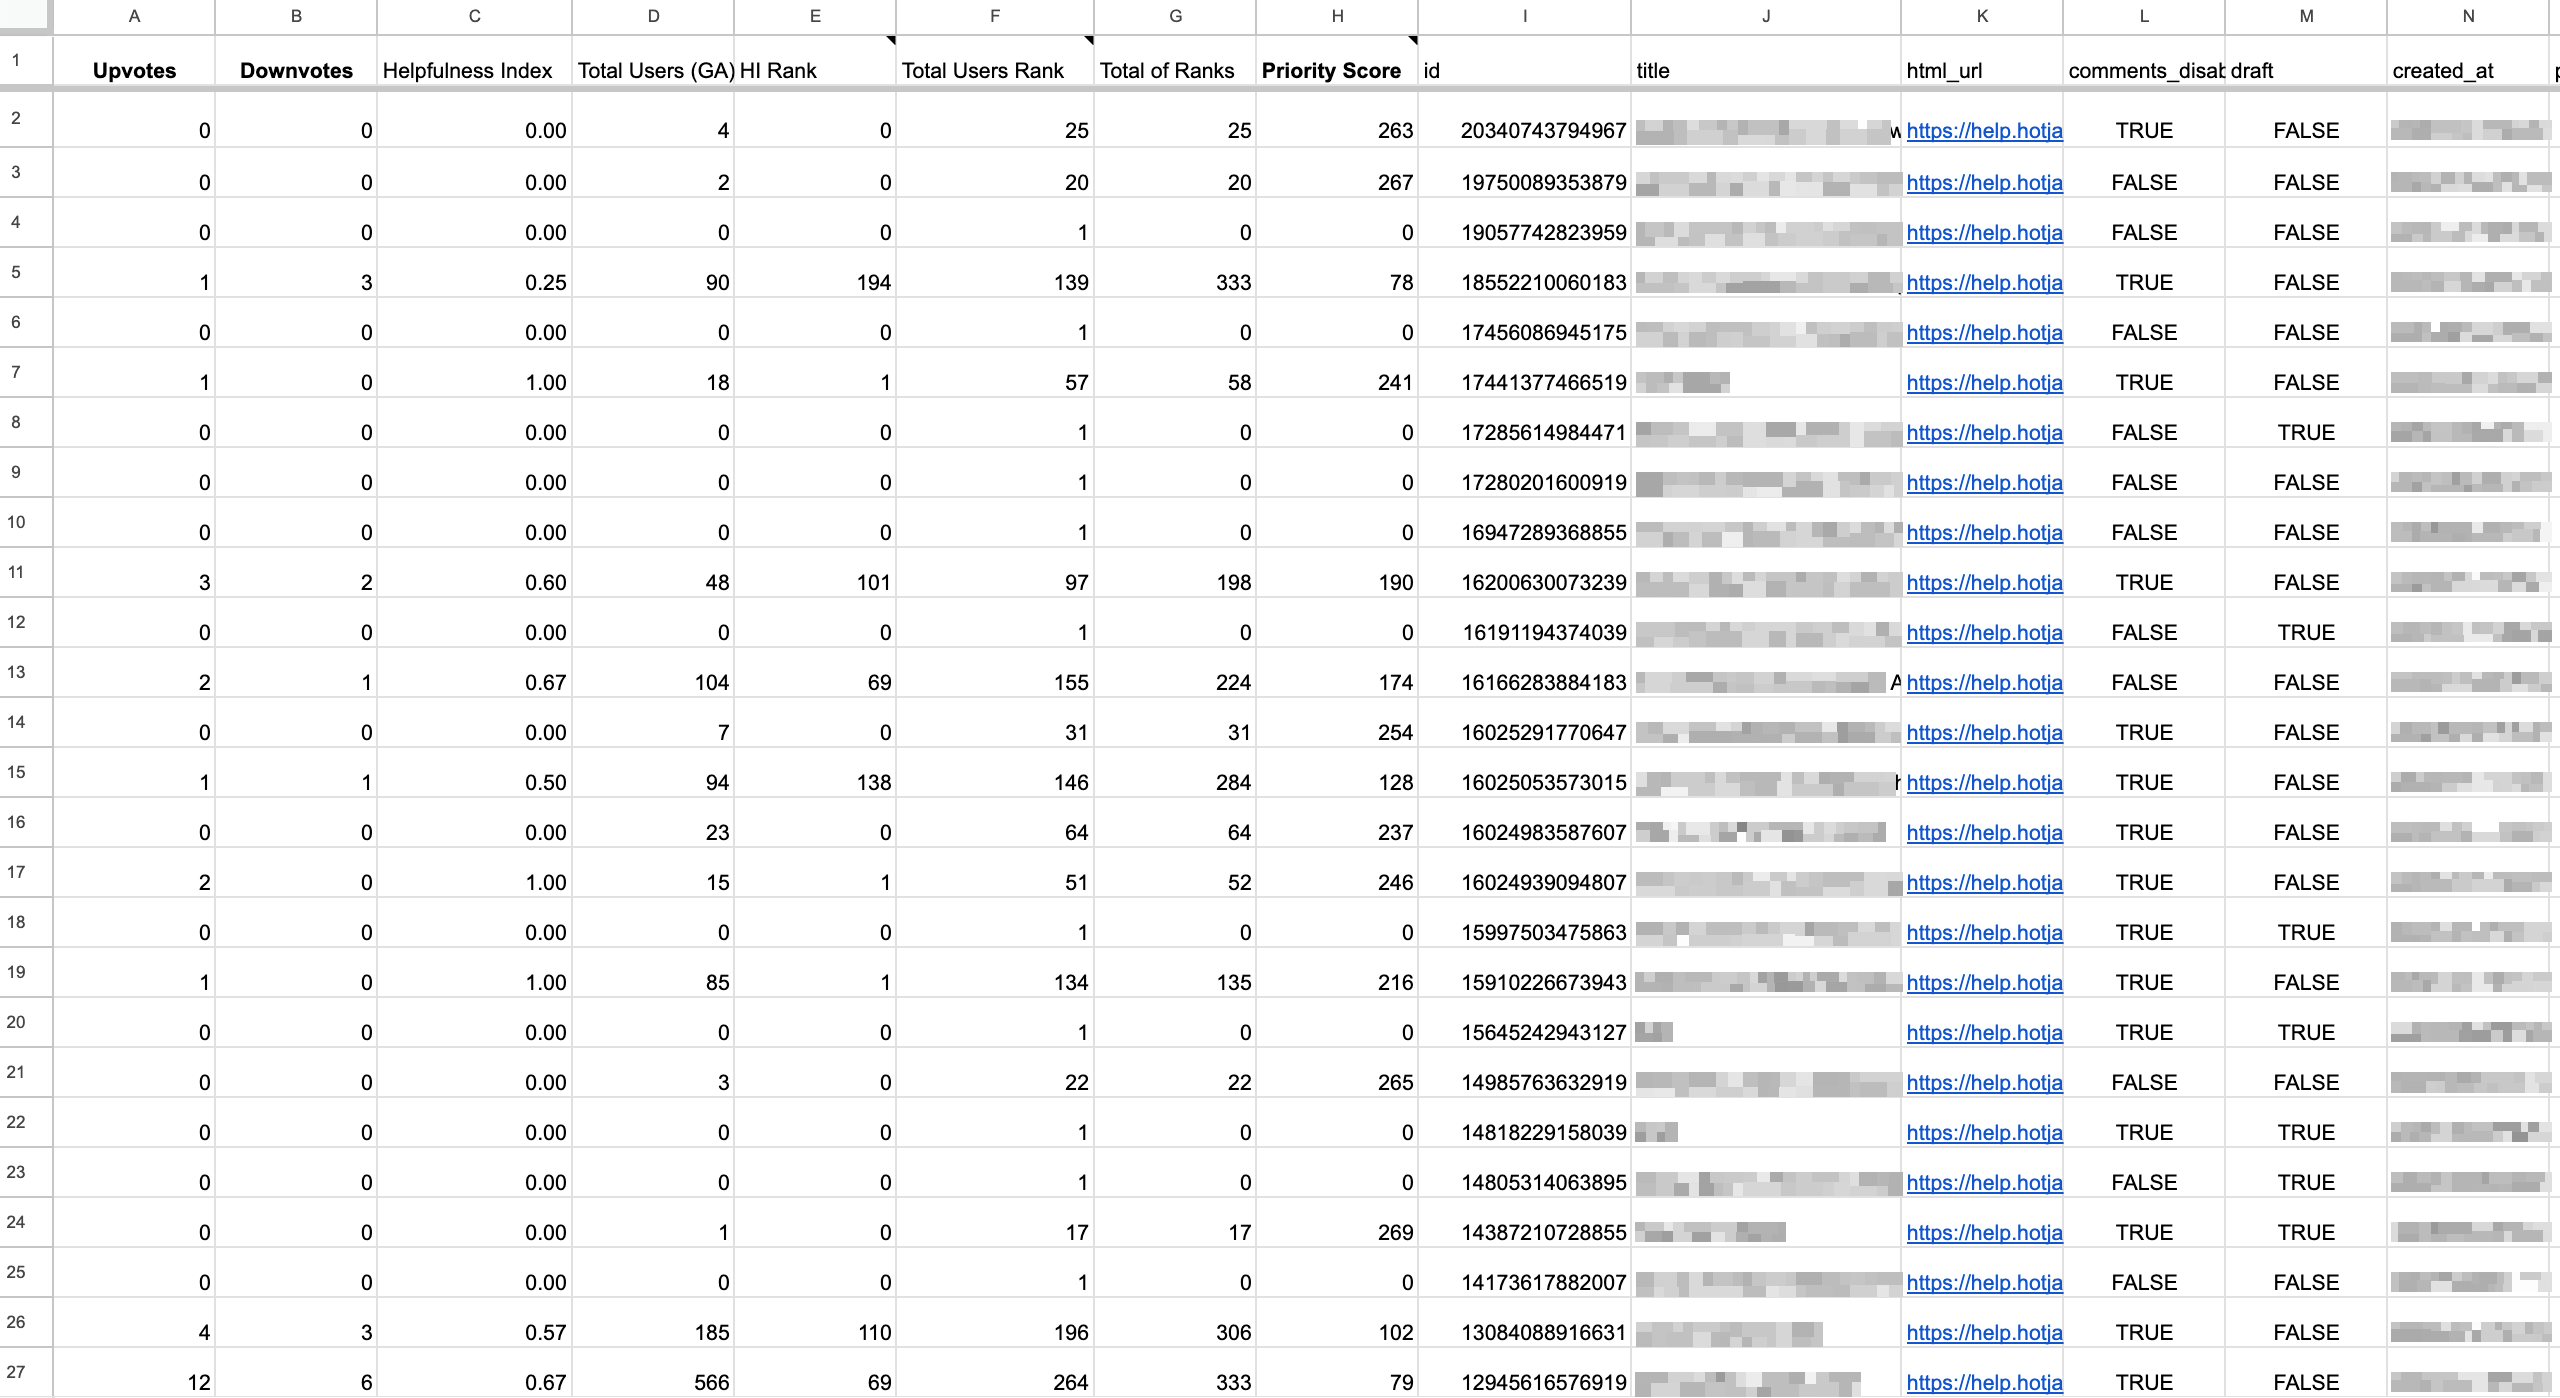
I use metrics to help make decisions and identify issues in the Hotjar Help Center. I achieve this with Google Analytics data, Algolia search analytics, and help center data such as an article helpfulness index. As a result, I can prioritize documentation updates and identify opportunities to improve the quality of educational content and how it can be delivered more effectively.
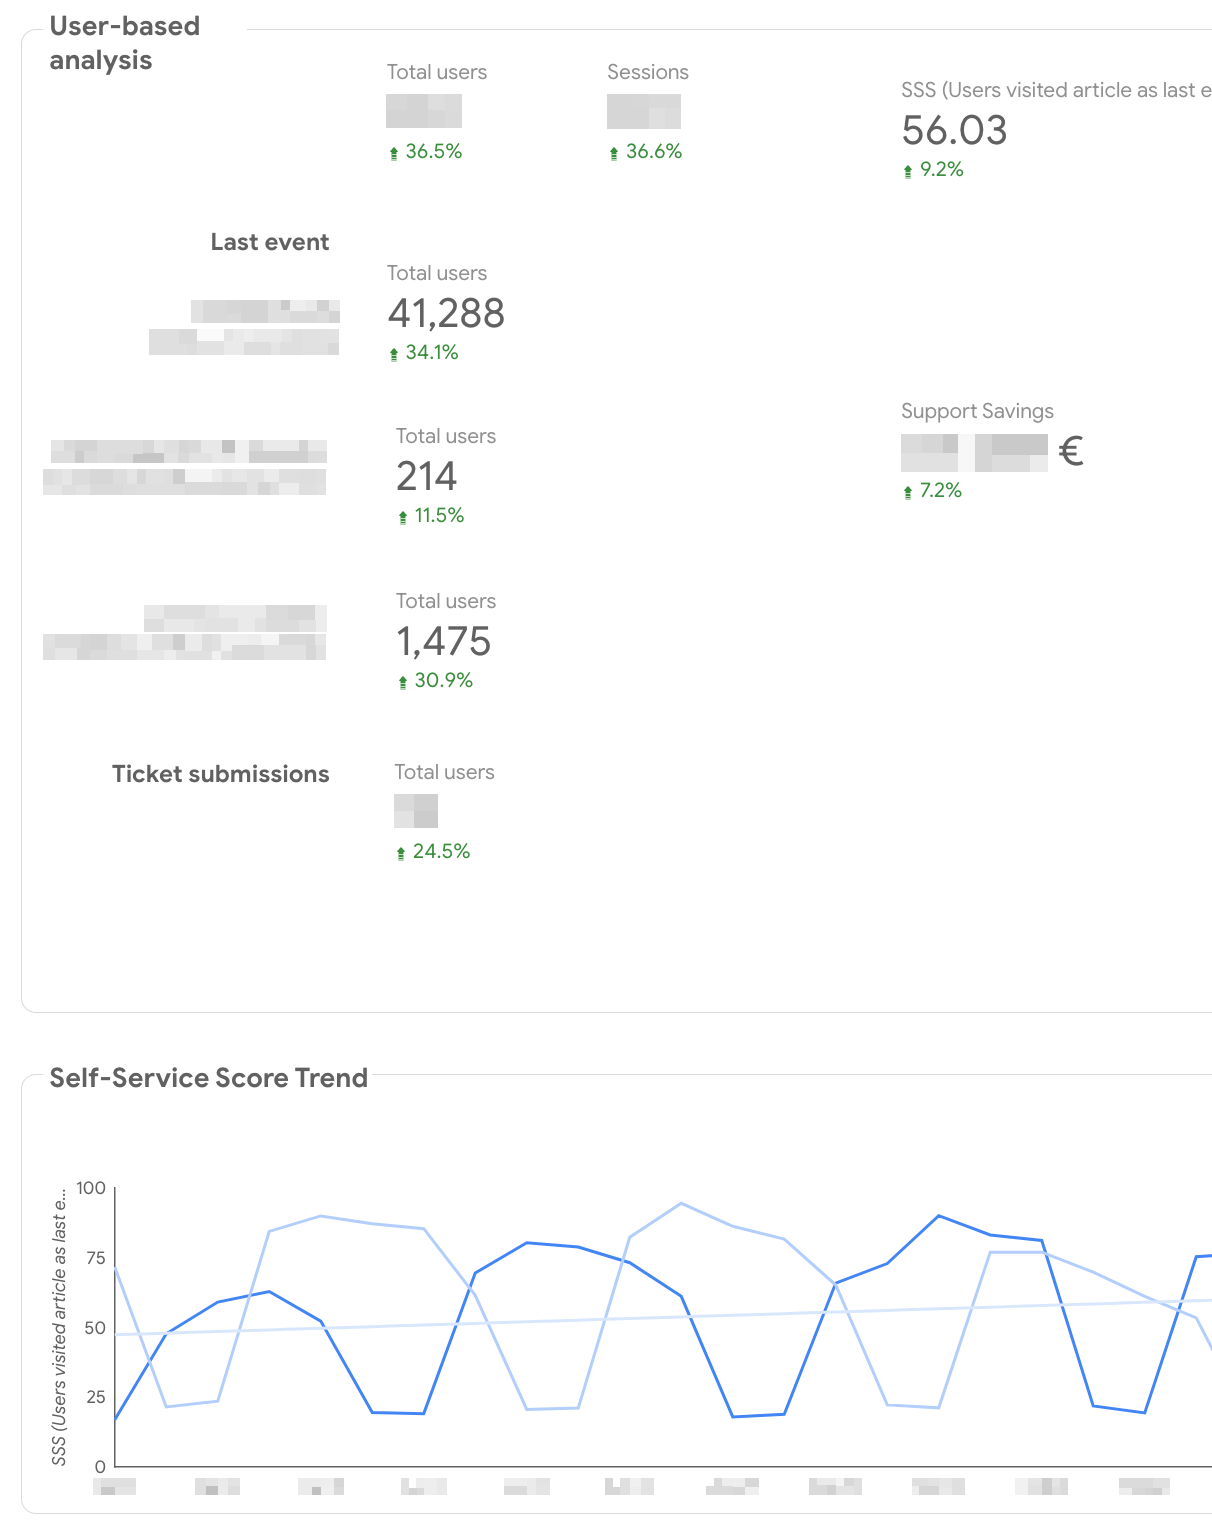
Google Analytics data allows for monitoring of the self-service score and is combined with cost-per-ticket details from the Support team, the cost savings provided by the Help Center through deflecting Support tickets can be tracked as an indicator of Help Center success.